
Computation & Mental Health
The last series of work took the form of a methodological investigation into generative design - the space in between computation and graphic design. Coming out of this series, I have gained a greater interest in the role of computation more generally within the broader societal context. As time passes it seems that artificial intelligence (AI), which is no more than a slightly more complex series of algorithms, is increasingly weaving its way into the underlying processes of our daily lives - from applying for a job or loan, to the articles that we read and the movies that we watch. As James Bridle wrote:
Reading a book, listening to music, researching and learning: these and many other activities are increasingly governed by algorithmic logics and policed by opaque and hidden computational processes. Culture is itself a code/space.
The danger of this emphasis on the coproduction of physical and cultural space by computation is that it in turn occludes the vast inequalities of power that it both relies upon and reproduces. Computation does not merely augment, frame and shape culture; by operating beneath our everyday, casual awareness of it, it actually becomes culture.
- James Bridle, New Dark Age (2018)

Within this evolving context, the next series of work would provide a new focus. There are a few areas in which I’m interested in examining how computation is playing or might play a role, but, as the dice fell, my task would be to look at its overlap with mental health and to produce an Instagram account with at least 21 posts.
The research process began objectively. I asked, ‘what is going on in this space?’, and found that there are some interesting things happening in the field of psychiatry and AI. Researchers are using a combination of MRI and functional MRI scanning in patients with diagnosed mental conditions to try and render out mappable synaptic pathways or areas of abnormal activity. They are then feeding these scans into an AI matrix in order to potentially be able to diagnose patients based on what their brain activity looks like on a functional level. In essence, trying to produce more tangible, physical evidence of pathology in a field which historically relies on subjective accounts to diagnose conditions.
“The idea is simple: use an algorithm to tease out actionable insights, putting data to feelings.”
As reported in the Verge article, “By making mental health disorders more physical, Chiu hopes to help destigmatize them as well. If it can be diagnosed as objectively and corporeally as heart disease, would depression or bipolar disorder or schizophrenia carry the same shame?” It should be noted that these advances are meant to help aid subjective diagnosis, not replace it (at least at this tentative stage). This use of computational technology is fascinating, however it is also quite dense, abstracted from tangible daily life, and in its infancy. It seemed that a journalistic investigation into this emerging field, although perhaps enlightening from a technical perspective, wouldn’t really yield anything of value for me or for others. The one aspect which I did carry through is this idea of making mental health more visible and tangible through data - something which I would return to later.
Having given up on an objective inquiry, I decided to try a more subjective study. Perhaps my content didn’t need to be about the overlap between mental health and computation, but instead I could give form to the experience of mental health through computation. This shift in thinking was a serendipitous combination of a lot of discussion about objectivity and subjectivity within the GCD community at this point in time (looking at you Rebecca and Matthew), as well as a chance reading of Fuck Content by Michael Rock, encapsulated by his ending remark:
As a popular film critic once wrote, “A movie is not what it is about, it’s how it is about it.” Likewise, for us, our What is a How. Our content is, perpetually, Design itself.
I have had some personal exposure to what it means to grapple with mental health issues, both through my medical professional experience and, more importantly, through some friends or family who I discovered have been living their lives with the burden of one form of mental illness or another. Mental illness is, for many, something that they will have to deal with for the majority of their lives. It is not easily diagnosed and less easily treated. Most importantly, it is often invisible. The combination of social stigma around mental health issues as well as the difficulty in describing exactly what one is going through often leads to sufferers being silent about their experience, which can create a sense of alienation and an inability to communicate well with others about obstacles they encounter to being ‘normally’ functioning members of society. Being able to better explain and communicate what one is going through is a challenge, both for the person themselves and for those around them.
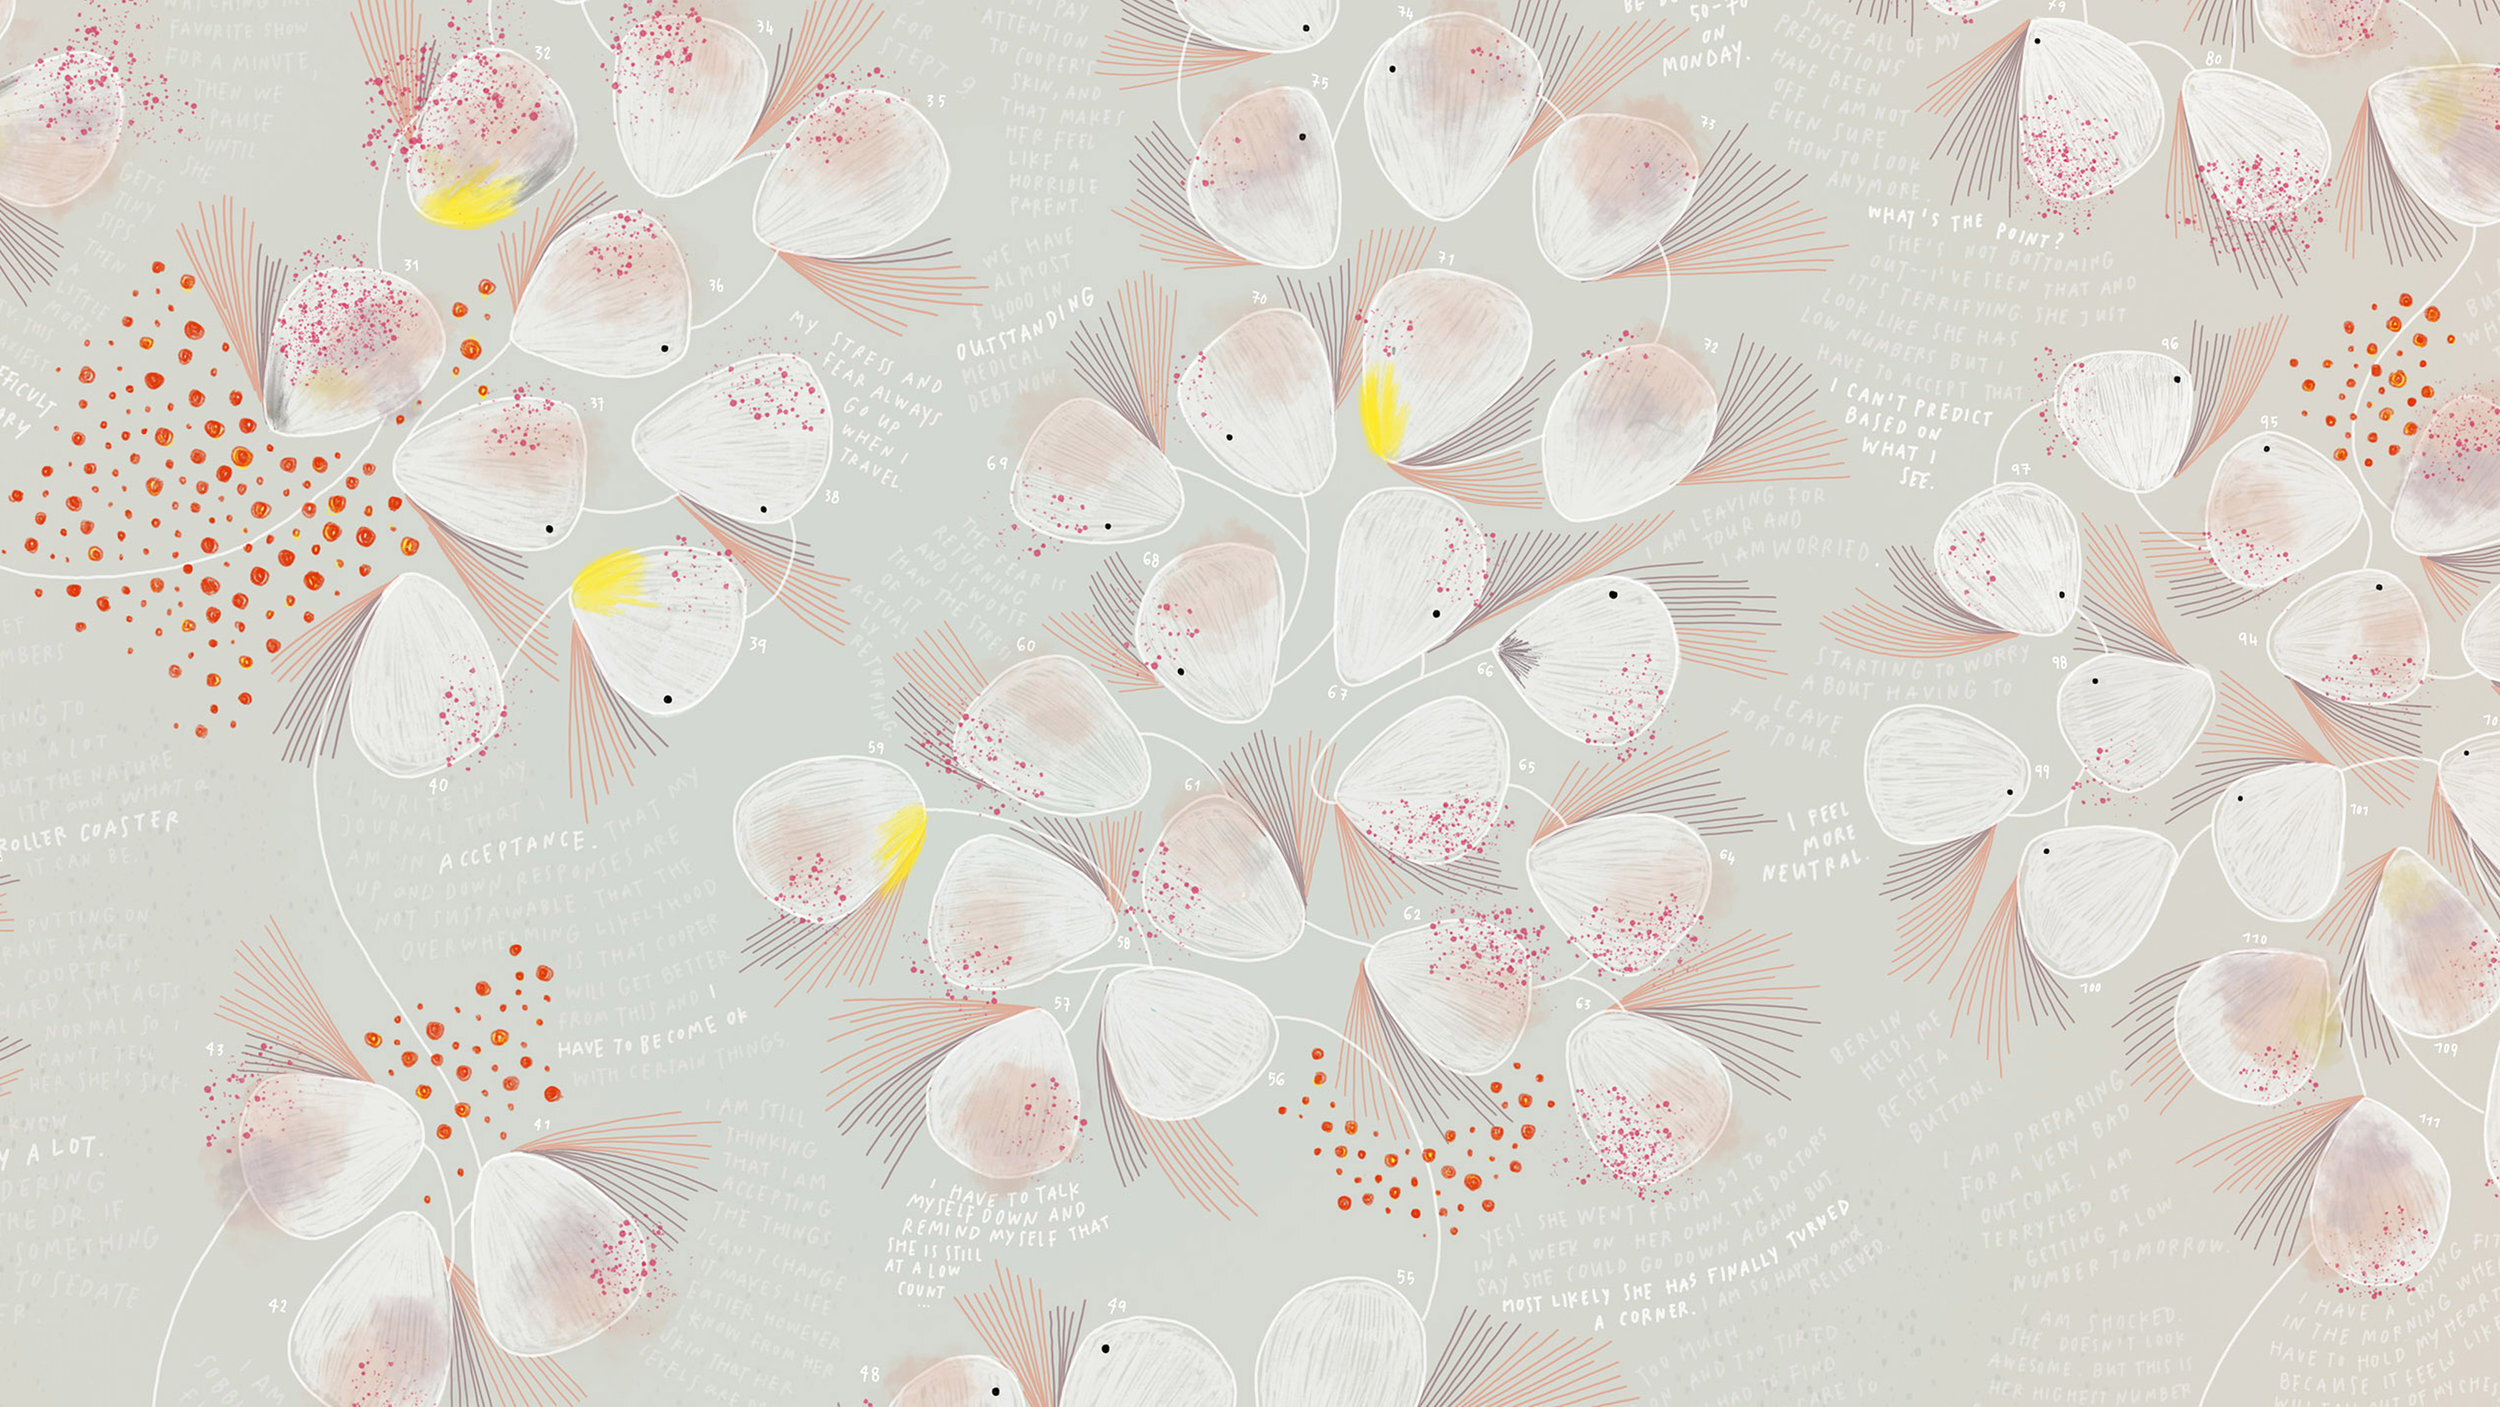
My main reference for the development of the project is a data visualisation project by Giorgia Lupi and Kaki King entitled ‘Bruises: The Data We Don’t See.’ It documents King’s experience caring for her daughter who was diagnosed with ITP (Idiopathic thrombocytopaenic purpura), based on daily observations and notes King made over a period of about 4 months. In her classic approach of data humanism, Lupi sought to “try to help her process and communicate her emotions: the feelings any of us experience when coping with our own illness, or that of a beloved one.” This idea of communicating an invisible experience through data visualisation would be the core idea of how my project developed.

How are you? - A mental health pictogram generator
The idea was to translate emotions and feelings commonly associated with the two most common forms of mental health - depression and anxiety - but which overlap with many other forms of mental health issues into a visual notational system. I referred to the most common diagnostic symptoms in the DSM-5 (Diagnostic and Statistical Manual of Mental Disorders, 5th Edition) for common symptoms, tailoring the list slightly after discussion with a friend. I then assigned a shape and colour to each variable. These were designed to be as semantically sensible as possible (eg. red is bad, green is good), however I didn’t let myself be tied down to finer details, instead focusing on building a functional system. I coded the interface in P5.JS and formatted it into a basic single page website on github. I decided to title it How are you? because this is such a common question that people ask each other on meeting almost every day yet we almost never answer it truthfully.
After some testing I realised not everyone knew what I was referring to by the titles of some variables or what positive and negative values meant, so I added a key section to the website for clarification if needed. I also added sections such as an indicator for whether it was being completed during the day or night, as well as a section to include any textual notes. The pictogram generator was shared through social media and on Whatsapp group chats, asking people to create their own pictogram, download it, and submit it either through Instagram DM or via email. I also asked them to include a short textual note, responding to the question ‘how are you?’, however not everyone did so (hence the addition of the textual element later on). The pictograms were uploaded anonymously to an Instagram account with the textual replies in the comment, if any.


Looking at the 28 submissions above, it is striking how some observations can be made very quickly. Even though these individuals were from different geographic and age demographics, almost all reported some level of anxiety and felt that their eating habits were abnormal. Once the key is known for interpreting the data, it becomes a lot easier to get a holistic picture of a person’s mental state, as well as to compare those of an entire cohort.
The feedback I received in class was largely positive. Many suggested incorporating more experiential aspects into the project, such as sound or moving image, or expanding on the diagnostic aspect using plotting axes and interpretation of the data from submissions to draw some conclusions. I did create a second version of the interface which added some basic animation and sound into the same interface, which was well-received during the critique.
Another point of note is the unexpected experience of interacting with individuals sending submissions. Often just saying ‘thank you’ for a submission felt curt, especially where it evidenced that the person was struggling with one issue or another. This sometimes led to open-hearted conversations with people with whom I would otherwise never have the chance to speak about these issues so openly. The idea that the project created a safe context for talking about mental health, and very naturally so, was very rewarding. This aspect was also picked up on during the feedback and I was encouraged to look into other possibilities for the integration of image and text more directly.
My intention with this project was to create something that would potentially help people understand their mental state, document their progress, and potentially facilitate open discussion about mental health. I feel that in this regard it has been successful. The instagram profile exists for the purposes of fulfilling the brief and I don’t believe the social media platform adds anything to it, especially as the pictograms are not meant to be interpreted in the absence of a key (which was not provided on IG). I feel that the project works best as a tool for personal study - a kind of tracker - because it makes it easy to measure one’s progress quickly and relatively accurately, as well as present it in a form that is simple and accessible.
Although many reacted positively to the more interactive form of the pictogram with the inclusion of motion and sound, I personally tend to disagree. Interactivity might make it more interesting for some, however it doesn’t add anything to what the project is trying to accomplish - to facilitate better communication and documentation. This generator is far too simplistic to be considered as a diagnostic tool, nor is it meant to facilitate treatment of any kind (as most visual mental health projects tend to do). Rather, I am more interested in data visualisation as a form of interpretation and expression, giving form to something that often feels intangible. The idea of experimenting more with textual elements, especially in the context of conversation, seems more interesting and I might potentially return to this suggestion down the line.
REFERENCES
Allan, C. (March 2017) ‘If we hide our mental health issues, we make it easier for society to ignore us’, The Guardian. Available at: https://www.theguardian.com/society/2017/mar/14/mental-health-problems-invisible-easy-to-dismiss (Accessed 16 Oct 2021).
Rock, M. (2009) ‘Fuck Content’, 2x4. Available at: https://2x4.org/ideas/2009/fuck-content/ (Accessed 16 Oct 2021).
Lupi, G. (no date) ‘Bruises: The Data We Don’t See’, Giorgia Lupi. Available at: http://giorgialupi.com/bruises-the-data-we-dont-see (Accessed 16 Oct 2021).
Simpson, J. (May 2017) ‘Visualising Mental Illness’, Open Democracy. Available at: https://www.opendemocracy.net/en/transformation/visualising-mental-illness/ (Accessed 16 Oct 2021).
Zarley, B. D. (Jan 2019) ‘Meet the Scientists who are training AI to diagnose mental illness’, The Verge. Available at: https://www.theverge.com/2019/1/28/18197253/ai-mental-illness-artificial-intelligence-science-neuroimaging-mri (Accessed 16 Oct 2021).